
Web GUI walkthroughs
Compose an estate on the canvas, place a fault, read the cost meter, then preview with a dry run.
Every image on this page is generated, not taken by hand. One command rebuilds all fifteen:
scripts/capture-docs-shots.py --bootstrap    # once, installs Playwright
scripts/capture-docs-shots.py               # rewrites docs/images/
If the interface changes, regenerate rather than redraw. The script drives a real
browser at 1440×900 against a real proteus serve, pinned to UTC so the timeline
labels are the same on every machine. Each image below names the shot that produces
it, so you can rebuild one without rebuilding the rest.
The estate is the default: proteus plan --preset northwind-rx, 18 services, 8 infra
nodes, 3 tenants, plus one noisy-neighbor fault the script adds so the inspector
and the timeline have something in them. That is rev 2, fingerprint
669cb6093015ceae. Every figure on this page is for that estate.
Note The machine these were captured on had an expired SSO token, so the AWS Pricing API could not be read and the cost figures come from the built-in fallback rate table. The footer says which —
builtin-fallbackhere,cache <region>or a live fetch when credentials work. The figure moves when the source does.
Starting it#
proteus serve
  GUI on http://127.0.0.1:8787   region us-west-2
  127.0.0.1 only. Nothing is sent to AWS until you press inject. Ctrl-C to stop.
It opens your default browser. Two options worth knowing:
proteus serve --port 8811 --no-open-browser
Use a different port when 8787 is taken. The error names the fix, and names the likely cause:
could not start on port 8787: could not bind 127.0.0.1:8787 ([Errno 48] Address
already in use). Another proteus serve may already be running; pass --port to pick
a different one.
try proteus serve --port 8788
Take that second sentence literally. A proteus serve already on the port answers
with its own world model, not yours, and nothing on the page says so.
Warning The server binds
127.0.0.1and never0.0.0.0, and it rejects any request carrying a foreignOriginheader. This is not configurable and should not be worked around: the process holds your AWS credentials and can spend money, so a page in another browser tab must not be able to drive the injector. See Web GUI for the full threat model.
Nothing reaches AWS until you press inject. Composing the estate, placing faults and watching the projection move are all local computation.
The layout#
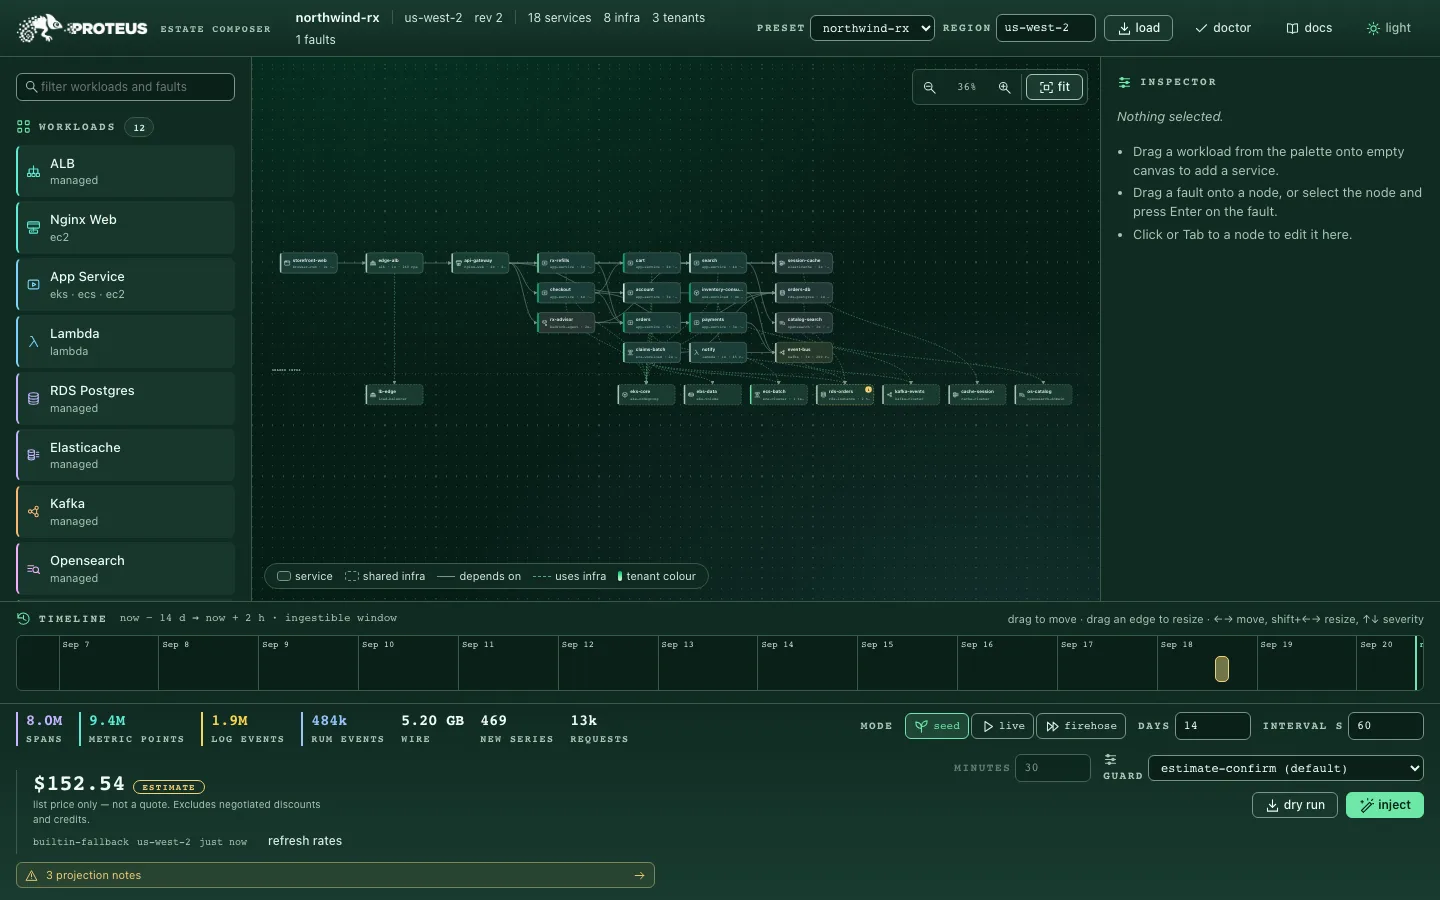
Five regions:
| Region | What it is for |
|---|---|
| Header | Model name, region, revision and counts; preset loader; doctor; a link to these docs; theme toggle |
| Palette (left) | Everything you can place: workloads, AWS resources, faults |
| Canvas (center) | The estate as a graph — services, infra, dependencies, tenant color |
| Inspector (right) | Whatever is selected, editable |
| Timeline (bottom) | Every fault's window against the 14-day ingestible range |
| Cost meter (footer) | Projected volume and dollars, plus the inject controls |
The header strip reads northwind-rx · us-west-2 · rev 2 · 18 services · 8 infra · 3 tenants · 1 faults, which is the same information proteus show prints in its
title panel.
The palette's three sections#
Three sections, each with its count in the heading. The counts come from the live registries — nothing in the palette is a hand-maintained list, so adding a workload or a fault in code makes it appear here on the next page load.
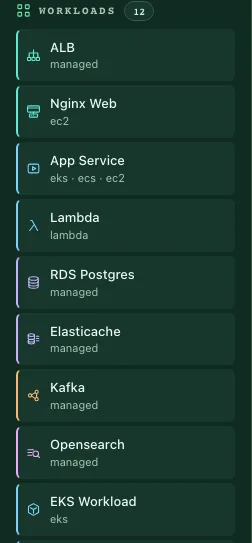
Workloads — 12. The hand-written archetypes, each with bespoke internal
behavior: ALB, Nginx Web, App Service, Lambda, RDS Postgres, Elasticache, Kafka,
Opensearch, EKS Workload, ECS Workload, Bedrock Agent, Browser RUM. The sub-label
is the runtime or runtimes the archetype is used with — eks · ecs · ec2 on App
Service, browser on Browser RUM.
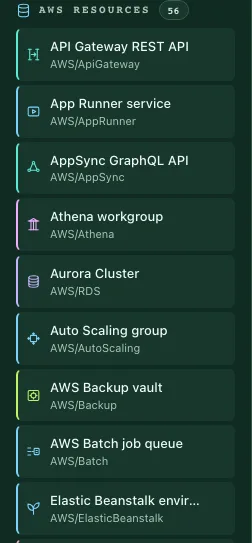
AWS resources — 56. The declarative workload profiles, each covering one AWS
namespace. The sub-label is the namespace itself: AWS/ApiGateway under API Gateway
REST API, AWS/RDS under Aurora Cluster, AWS/AppSync under AppSync GraphQL API.
Sorted by label, so scroll or filter.
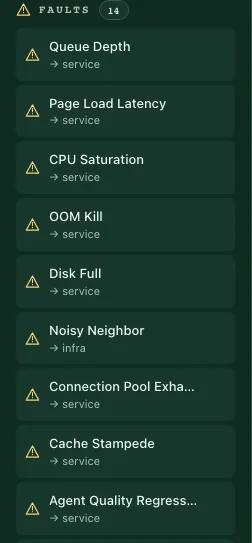
Faults — 14. Each with its drop target as the sub-label.
Read that second sub-label before you drag. Thirteen faults say → service. One —
Noisy Neighbor — says → infra, because contention over a shared resource has no
aggressor when it is aimed at a service, and would be silently inert. The palette
will not offer it as a service drop target.
Filtering#
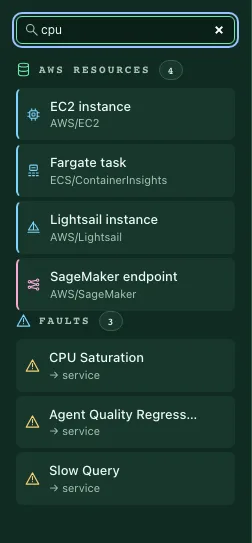
The search box filters all three sections at once, and each heading's count becomes the count of matches. A section with no matches disappears rather than showing zero.
The filter reaches past the visible label. Typing cpu matches four AWS resources
whose names do not contain "cpu" at all — EC2 instance, Fargate task, Lightsail
instance, SageMaker endpoint — because it also searches what each profile emits. So
a search is a way to find the workload that produces a metric you care about, not
only the one whose name you remember.
Composing an estate#
Three ways to add to the canvas, and the inspector tells you all of them when nothing is selected:
Drag a workload from the palette onto empty canvas to add a service.
Drag a fault onto a node, or select the node and press Enter on the fault.
Click or Tab to a node to edit it here.
Placing a workload#
Drag any Workloads entry onto empty canvas. It becomes a service with that archetype, and the inspector opens on it so you can name it, set its instance count and request rate, assign a tenant, and wire its dependencies.
Placing an AWS resource#
Drag an AWS resources entry onto empty canvas the same way. What you get is a
service whose archetype is custom and whose kind names the profile. custom is
the archetype that delegates to a profile rather than to bespoke code. The profile
declares its metrics — and for each metric, the real AWS metric it stands in for.
Where that mapping is unconfirmed it is left null and shown as unknown rather than
guessed. See the catalog.
Editing a node#
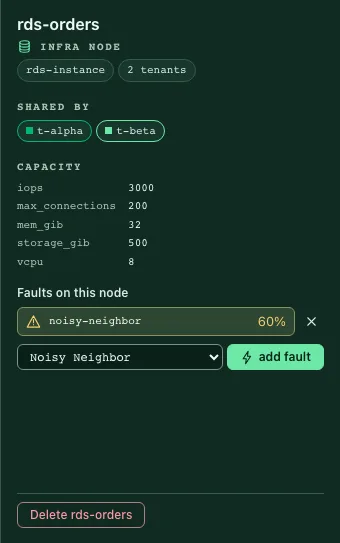
Click a node — or Tab to it; every node on the canvas is a real focusable button —
and the inspector fills in. For the rds-orders infra node that is:
rds-instance, shared by2 tenants- SHARED BY
t-alphaandt-beta, as color-coded tenant chips - CAPACITY:
iops 3000,max_connections 200,mem_gib 32,storage_gib 500,vcpu 8 - Faults on this node: the existing
noisy-neighborat60%, with an×to remove it, and anadd faultcontrol below - Delete rds-orders at the bottom
That SHARED BY list is what makes noisy-neighbor findable on this node: two
tenants share the instance, so one can starve the other.
Placing a fault#
Drag a fault from the palette onto a node. Keyboard equivalent, and the one shown here: select the node, then press Enter on the fault in the palette.
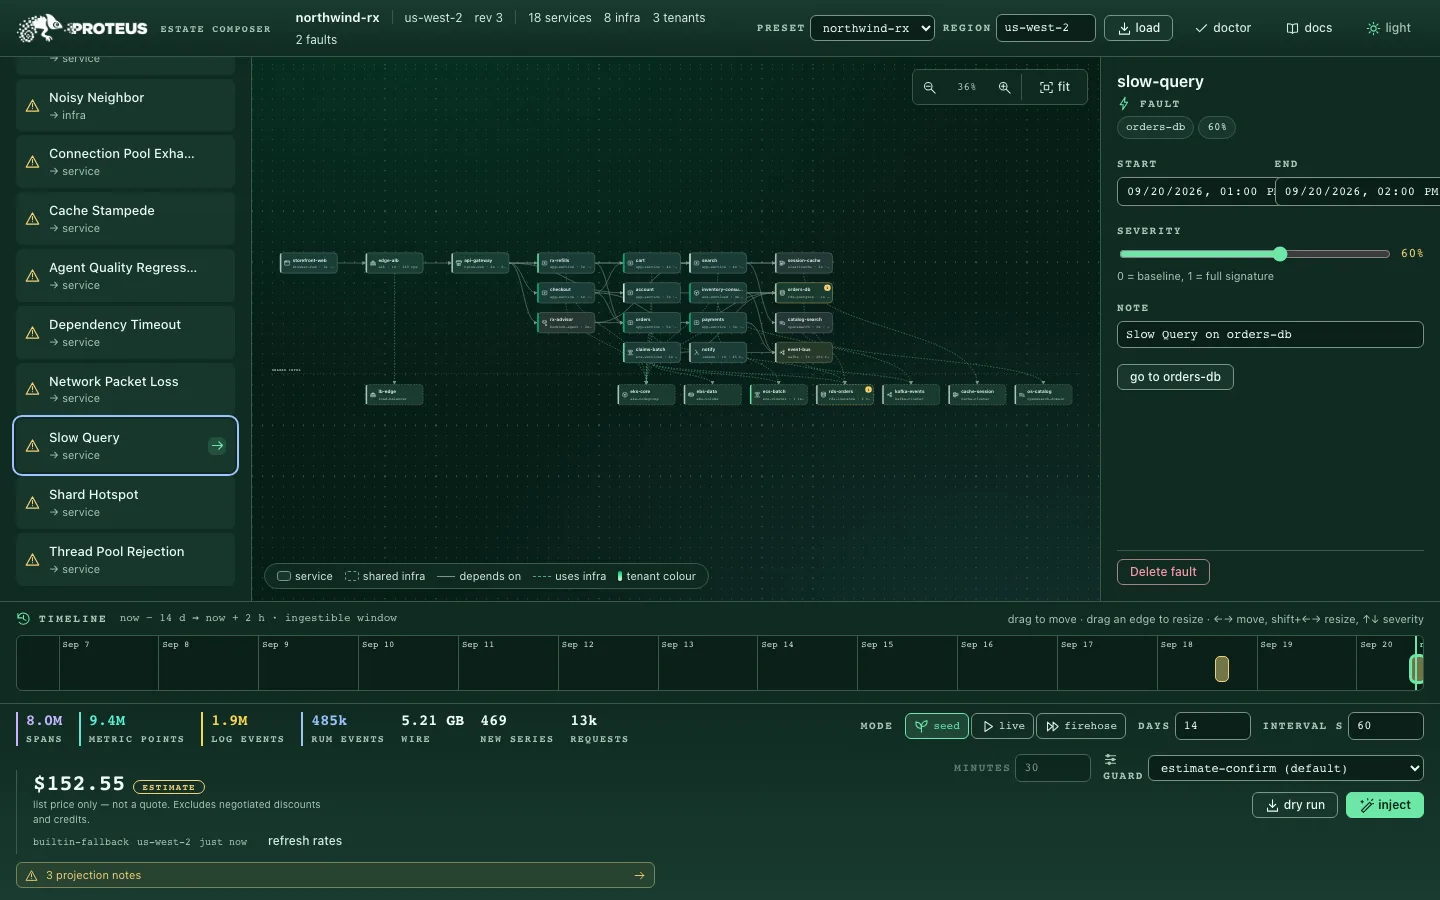
One action lands in four places at once, which is the thing to watch for:
- a chip on the node itself, so the canvas shows where the estate is broken;
- a block on the timeline at the new fault's window;
- the inspector, switched to the fault, with editable START and END, a
SEVERITY slider labeled
0 = baseline, 1 = full signature, a NOTE, a go to link back to the target, and Delete fault; - the header and the cost meter, both re-derived —
rev 2becomesrev 3,1 faultsbecomes2 faults, and the projection moves.
A fault placed this way starts at the current time. Drag it on the timeline to put
it in the past, which is what you want before a seed.
The timeline#

TIMELINE   now − 14 d → now + 2 h · ingestible window
drag to move · drag an edge to resize · ←→ move, shift+←→ resize, ↑↓ severity
The axis is relative, not fixed: it always runs from fourteen days ago to two hours ahead, so the dates on it advance every day. Drag a block to move its window, drag an edge to resize it, and arrow keys do the same from the keyboard, with Shift to resize and up/down for severity.
Note the scale. A one-hour fault on a fourteen-day axis is a sliver about one pixel
wide per two minutes, too narrow to letter; its full description —
noisy-neighbor on rds-orders, severity 60%, Sep 24, 09:20 to Sep 24, 10:20 — is
the block's accessible name and its tooltip rather than visible text. Zoom the
window by shortening it, or read the fault in the inspector.
The now + 2 h right edge is not arbitrary: it is the widest future timestamp the
OTLP endpoints accept. See the AWS limits table.
The viewBox camera#
The canvas is an SVG with a moving viewBox, not a scaled bitmap, so text stays
sharp at every zoom. The toolbar sits top-right: zoom out, the current scale as a
percentage, zoom in, and fit.
Keyboard, when the canvas itself has focus — the "Skip to the topology canvas" link at the top of the page puts it there:
| Key | Action |
|---|---|
+ or = |
Zoom in, by a factor of 1.2 |
- or _ |
Zoom out, by a factor of 1.2 |
0 |
Fit the whole estate to the viewport |
| Arrow keys | Pan |
Zoom is clamped to 0.2×–2.5×. fit clamps to at most 1.0×, so fitting a small estate does not blow it up past its natural size. The 18-service default fits at 36%.
Drag on empty canvas to pan; the scroll wheel zooms toward the pointer. Clicking empty canvas to focus it is not free — a click that lands on a node selects that node — so use the fit button or the skip link when you only want the camera.
The cost meter#

The footer projects the whole run and updates as you edit. For the default estate over 14 days at a 60-second interval:
8.0M SPANS   9.4M METRIC POINTS   1.9M LOG EVENTS   484k RUM EVENTS
5.19 GB WIRE   469 NEW SERIES   13k REQUESTS

$152.54  ESTIMATE
list price only — not a quote. Excludes negotiated discounts and credits.
builtin-fallback us-west-2  just now   refresh rates
Three things on that block are worth reading every time.
$152.54 ESTIMATE. It comes from the same code as the CLI's projection, so the
two agree for the same estate and window. It is list price and it is not a quote.
builtin-fallback us-west-2 just now. The provenance of the rates, and the
reason to read it: this run had no working credentials, so the figure is from the
hand-copied us-east-1 table compiled into the build. With credentials it reads
aws-pricing-api, or cache <region> with an age when a previous fetch is still
warm — rates are cached per region for 24 hours, and refresh rates re-fetches
them.
3 projection notes. A collapsed drawer holding every caveat the projection
attached. Expand it before quoting the number to anyone. The count is not fixed; it
is however many caveats this particular run generated.
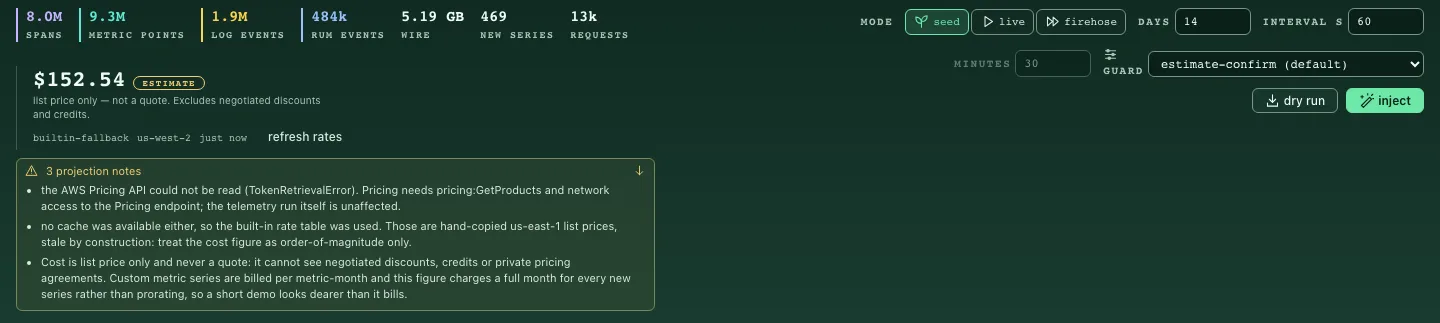
Change the mode, days or interval and every number moves. Switching the estate moves them too: adding a service adds its metric series, which is the term that dominates a short run.
Note Two things stop these figures being constants, and both are expected.
The projection window is anchored to
now, and the modeled traffic curve is diurnal, so the same command a minute later counts slightly different metric points and RUM events. Runningproteus seed --days 14three times on the untouched preset gave $152.53, $152.73 and $152.74 — a spread of about 0.1%. Spans and new-series counts were identical each time.The footer and the CLI also report bytes in different units, which is not a disagreement. This footer is decimal —
5.19 GBis 5.19 billion bytes. The CLI's projection panel is binary and says so, printing the same quantity as4.8 GiB. They used to both say GB, which made them look 7% apart.
Preview with a dry run#
dry run runs the whole pipeline locally and sends nothing. Server-side it forces
the paranoid guard policy, so it makes no network call at all — not even to the
Pricing API.
Set the mode (seed, live or firehose), the days and interval, then press dry
run. It starts immediately without a confirmation dialog, because paranoid
requires no confirmation.

Progress arrives over server-sent events, one row per signal, updating as batches are rendered. The guard's notes are printed into the job log as it starts, so the reason a figure is what it is sits next to the figure.
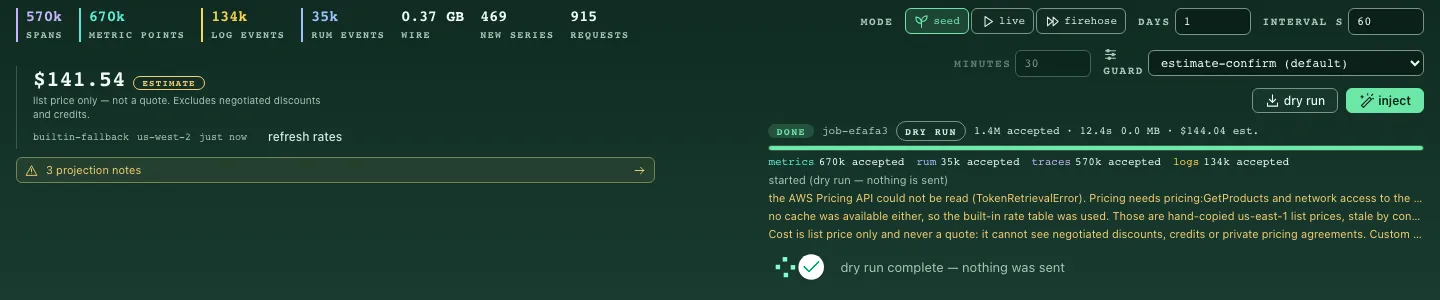
DONE   job-9c190e  [DRY RUN]  1.4M accepted · 10.7s  0.0 MB · $144.08 est.
metrics 670k accepted   rum 35k accepted   traces 570k accepted   logs 134k accepted

dry run complete — nothing was sent
0.0 MB is the tell that it was a dry run: records were counted, nothing was
batched for the wire.
That run is one day of the default estate, not fourteen: 570k spans, 670k metric points, 134k log events, 35k RUM events, 0.38 GB.
The two dollar figures on screen are not a contradiction. The footer reads
$141.56; the job strip reads $144.08 est. The footer is a projection of the
window you asked for. The job strip prices what the job actually rendered, which is
not quite the same set of records. When the footer has live Pricing API rates the gap
widens, because a dry run forces paranoid and paranoid deliberately disables the
pricing lookup so that nothing leaves the machine — so the job falls back to the
built-in table while the footer does not.
Warning Only one job runs at a time. Starting a second while one is running offers to attach to the running job's progress instead. Do not treat a running dry run as a reason the inject button is unresponsive — attach and watch it finish.
Injecting#
Cost inject makes real API calls to CloudWatch and is billed at CloudWatch list rates. Read the cost meter and expand the projection notes first. This is the only button on the page that spends money.
The inject button is styled as the primary action and dry run sits beside it. Pressing it opens a confirmation dialog.
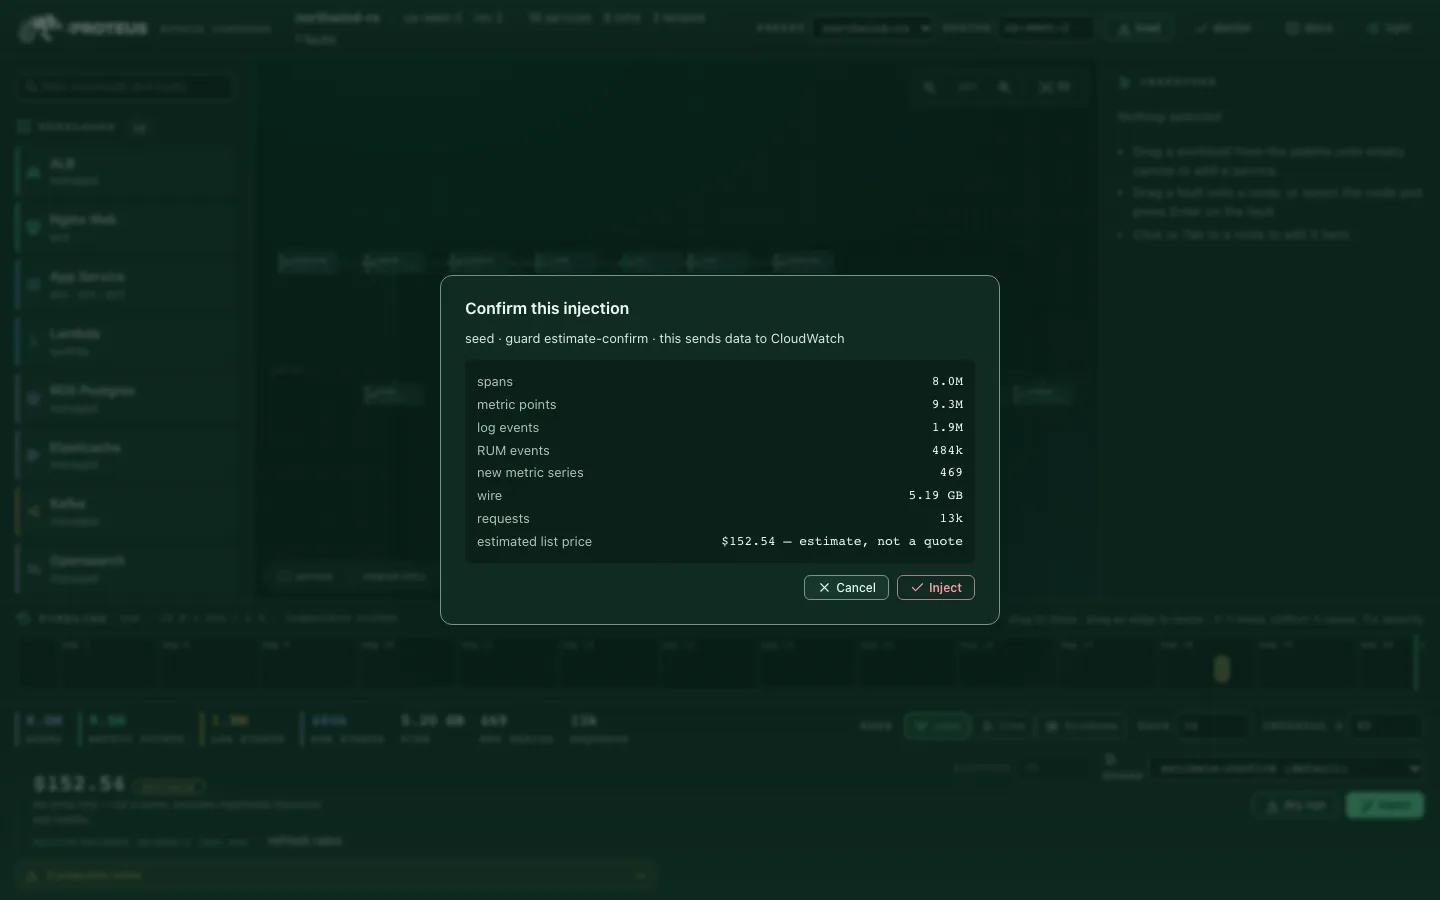
It names the mode, the guard policy in force and the volume, and says plainly
this sends data to CloudWatch. The dry-run version of the same dialog says
dry run, nothing is sent instead. The confirm button is labeled Inject and
marked as the dangerous action.
The dialog is not the real gate. The server gates on the guard's own decision, so a
guard policy that requires confirmation makes the API refuse an unconfirmed request
regardless of what the page does. The GUARD selector in the footer offers the
same five policies as the CLI, defaulting to estimate-confirm (default).
Progress then streams exactly as it does for a dry run, with real MB figures and
rejected counts. A failed run is reported as failed, not dressed up as a success.
Confirm it worked. The job strip reads DONE, every per-signal row shows
accepted with no rejections, and MB is non-zero. Then allow a few minutes for
CloudWatch to index the new telemetry before you look for it in Omni.
Preflight from the GUI#
The doctor button in the header runs the same read-only checks as
proteus doctor and shows them in a dialog.
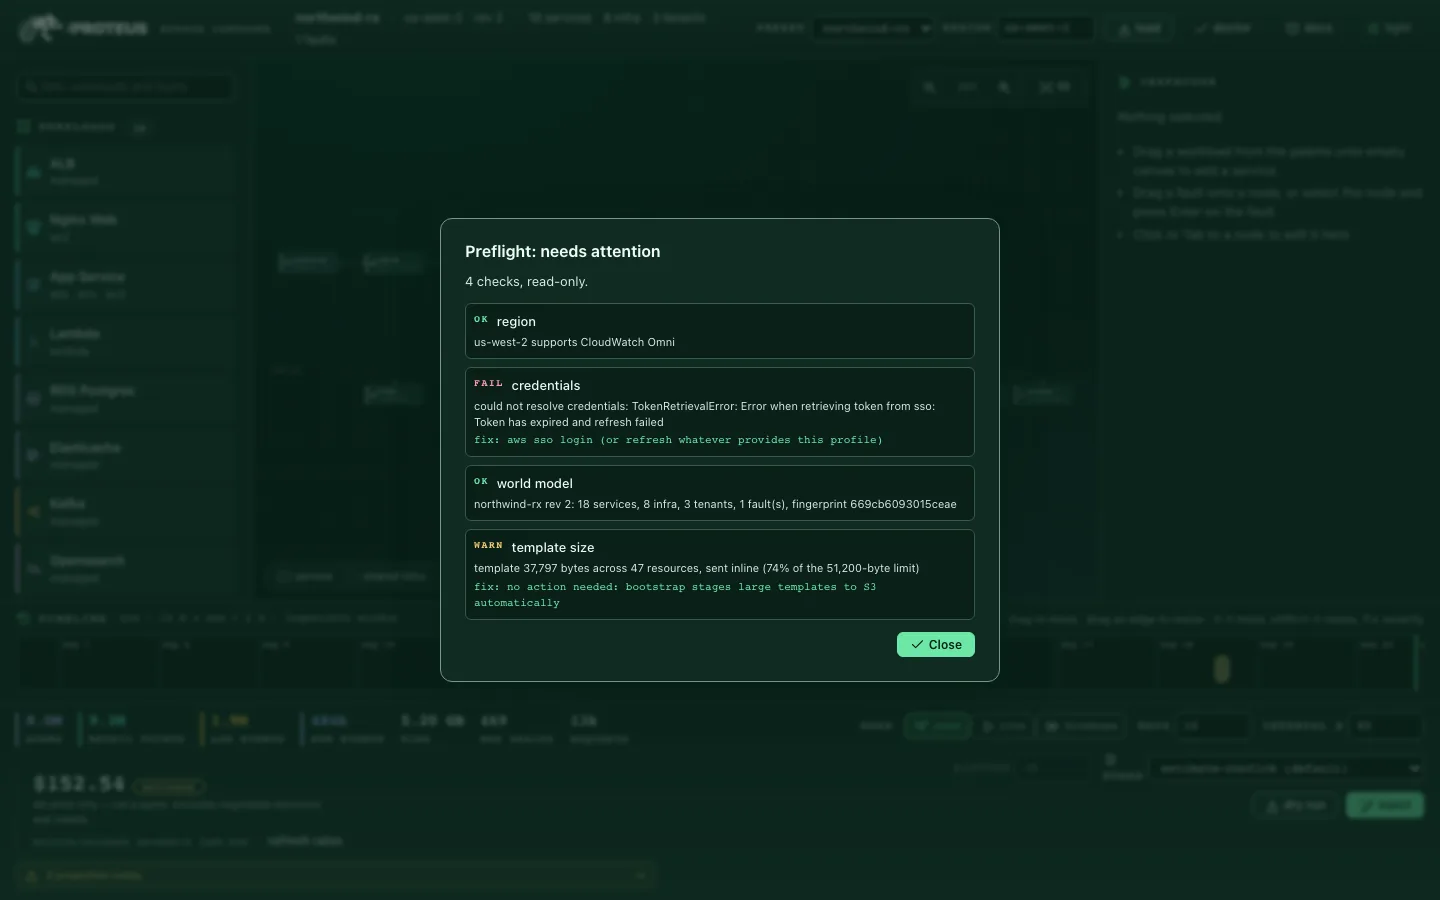
Preflight: needs attention
4 checks, read-only.

OK    region          us-west-2 supports CloudWatch Omni
FAIL  credentials     could not resolve credentials: TokenRetrievalError: Error
                      when retrieving token from sso: Token has expired and
                      refresh failed
                      fix: aws sso login (or refresh whatever provides this profile)
OK    world model     northwind-rx rev 2: 18 services, 8 infra, 3 tenants,
                      1 fault(s), fingerprint 669cb6093015ceae
WARN  template size   template 37,797 bytes across 47 resources, sent inline (74%
                      of the 51,200-byte limit)
                      fix: no action needed: bootstrap stages large templates to
                      S3 automatically
Same verdicts, same fixes, same read-only guarantee as the CLI. The dialog title
changes with the result — Preflight: needs attention when something failed. Run it
before you inject; it is faster than debugging a rejected batch.
Loading a preset#
The header's PRESET selector lists all seven presets — ai-chatbot,
alb-fleet, minimal, ml-pipeline, northwind-rx, three-tier and
web-server — and load replaces the estate with the one you picked. It is the
GUI's equivalent of proteus plan --preset, and it discards the estate on screen the
same way, so compose from a preset rather than into one. The
CLI walkthroughs describe what each one contains.
Theme#
The header's rightmost button toggles light and dark. Your choice is the only
preference stored in the browser — canvas positions persist server-side instead, in
$PROTEUS_HOME/layout.json. A small classic script applies the stored theme before
first paint, so reloading in dark mode does not flash white.
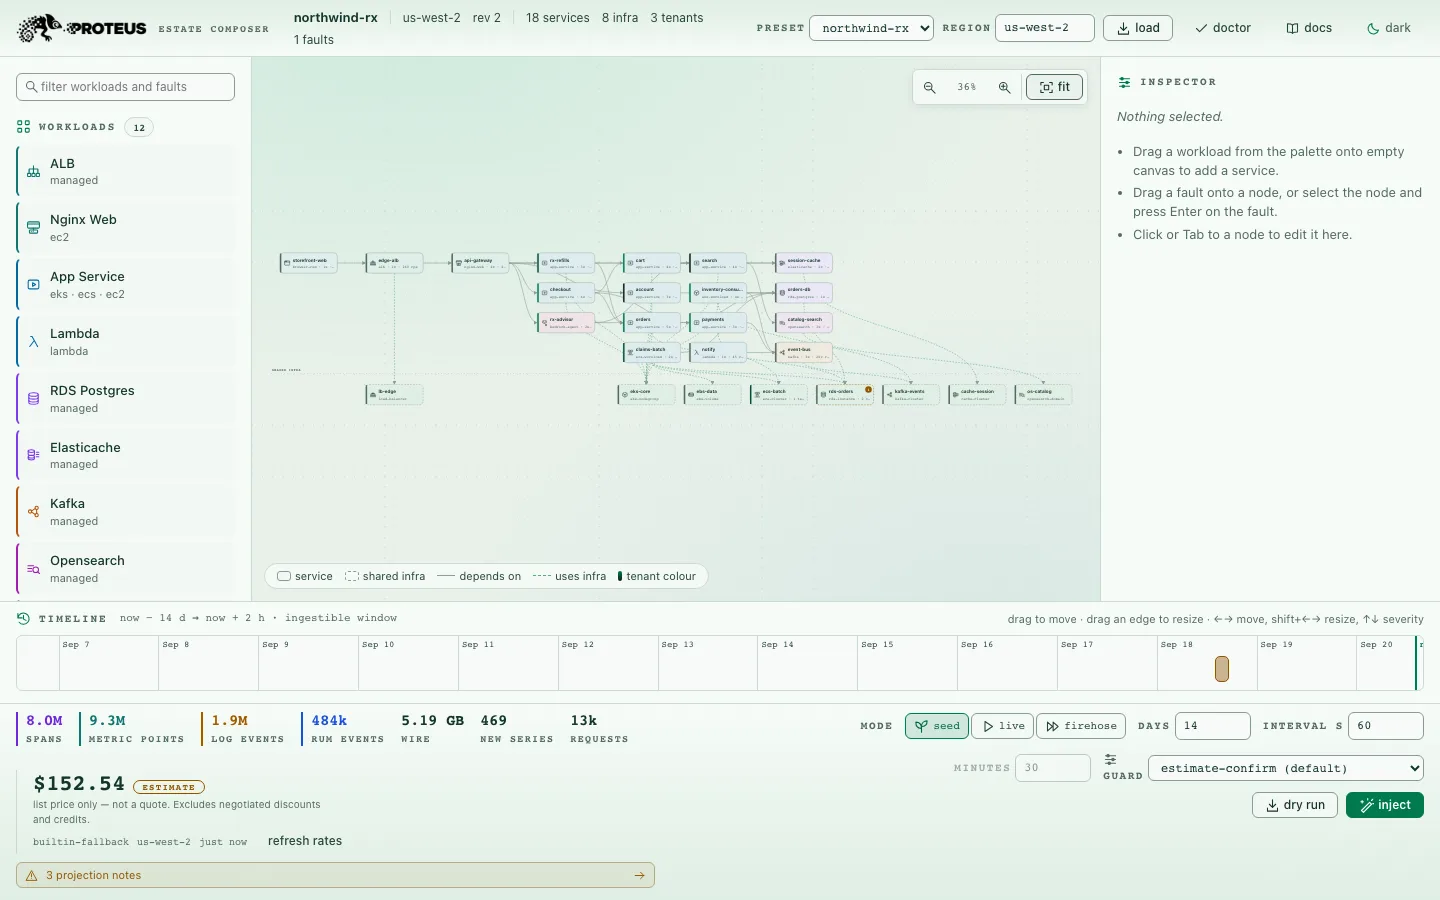
Both themes are first-class rather than one being an inversion of the other — tenant colors, the fault severity chips and the canvas grid each have their own values per theme. Charts and the cost meter read correctly in both.
No build step#
The GUI has no npm dependencies at all. There is no package.json anywhere in
the repository. It is vanilla ES modules under proteus/web/static/js/, reached from
a single <script type="module">, plus one classic script that applies the stored
theme before first paint, hand-written CSS, and a Python stdlib HTTP server.
That means there is nothing to install and nothing to compile. Edit a .js file,
reload the page, see the change. It also means the GUI cannot rot: there is no
transitive dependency tree to audit and no lockfile to resolve. See
Web GUI for what that costs in exchange.