
One estate, four signals
Metrics, logs and traces over OTLP/HTTP; RUM to the CloudWatch RUM data plane. Four signals from one model, not four integrations that agree on nothing.


Build a distributed system that does not exist. Inject its metrics, logs, traces and RUM into Amazon CloudWatch, and demo Omni against something that behaves like production.
Proteus models an estate - services that call each other, tenants that share infrastructure, a diurnal traffic curve - then renders its telemetry and sends it to CloudWatch over OTLP.
It is not random noise. The data is synthetic; the shape of it is the point.
You get metrics, logs, traces and RUM for a distributed system you never had to build, and a console populated enough to demo Omni and the DevOps Agent against something that behaves like production.
PutMetricData.A metric can name a node. Only a trace can name an edge.
PutMetricData does carry service identity: an
EntityMetricData entry takes an
Entity whose
KeyAttributes accept Type, ResourceType, Identifier,
Name and Environment, and two datapoints sharing those key attributes are
treated as the same entity. What no part of that call carries is a second
endpoint. Count the fields and there are thirteen - nine on
MetricDatum, two on
Dimension, two on
Entity - and not one of them means peer, parent,
caller, callee or dependency. An entity identifies one thing, never a pair.
A span does carry the pair. Ours set
peer.service and
parent_span_id on every outbound call, which is the
edge stated explicitly rather than inferred. So the choice is not identity
against nothing - it is nodes against nodes and edges.
Proteus speaks OTLP over HTTP to the three AWS-native endpoints - CloudWatch, X-Ray and Logs - so the nodes, the edges and the correlated logs arrive together instead of one at a time.
Metrics, logs and traces over OTLP/HTTP; RUM to the CloudWatch RUM data plane. Four signals from one model, not four integrations that agree on nothing.
Resource attributes are what draw the topology. Proteus sends the ones the service map is built from.
Plan an estate, confirm it is ready, price the backfill without sending it, then look at the faults you can inject and the estate you just built.
proteus · us-west-2
proteus plan
wrote northwind-rx to /tmp/proteus-home/world.json: 18 services, 8 infra nodes, 3
tenants
next: proteus bootstrap then proteus seed
proteus doctor --region us-west-2
 check              ┃      ┃ detail
━━━━━━━━━━━━━━━━━━━━╇━━━━━━╇━━━━━━━━━━━━━━━━━━━━━━━━━━━━━━━━━━━━━━━━━━━━━━━━━━━━━━━━
 region             │ OK   │ us-west-2 supports CloudWatch Omni
 credentials        │ OK   │ account <your-account-id> as <your-iam-identity>
 world model        │ OK   │ northwind-rx rev 1: 18 services, 8 infra, 3 tenants, 0
                    │      │ fault(s), fingerprint d7caf912a5a9862f
 template size      │ WARN │ template 37,797 bytes across 47 resources, sent inline
                    │      │ (74% of the 51,200-byte limit)
 transaction search │ OK   │ destination CloudWatchLogs, ACTIVE
 log groups         │ OK   │ all 18 group(s) the renderer can write to exist
 log retention      │ OK   │ 22 log group(s), all retaining at least 14 days
 stack              │ OK   │ proteus-northwind-rx is CREATE_COMPLETE
 model vs stack     │ WARN │ world model fingerprint d7caf912a5a9862f does not
                    │      │ match the deployed 4648d1448e038cfe - the estate has
                    │      │ changed since bootstrap, so some services may have no
                    │      │ log group or alarm
 bedrock            │ OK   │ Bedrock reachable in us-west-2; model
                    │      │ us.anthropic.claude-sonnet-4-5-20250929-v1:0 is
                    │      │ offered there

suggested fixes
  template size: no action needed: bootstrap stages large templates to S3
automatically
  model vs stack: proteus bootstrap   (re-applies the stack)
proteus seed --dry-run --region us-west-2 --yes
╭─────────────────────────────────── projection ───────────────────────────────────╮
│ Projected volume                                                                 │
│   spans                7,983,360                                                 │
│   metric points        9,354,240                                                 │
│   log events           1,874,880                                                 │
│   RUM events             483,840                                                 │
│   new metric series          469                                                 │
│                                                                                  │
│ Projected wire traffic (uncompressed)                                            │
│   traces                  3.1 GB                                                 │
│   metrics                 1.0 GB                                                 │
│   logs                  679.4 MB                                                 │
│   total                   4.8 GB                                                 │
│   requests                12,762                                                 │
│                                                                                  │
│ Estimated cost  ~ $187.50 USD  (approximate, not a quote)                        │
│                                                                                  │
│ Warnings                                                                         │
│   ! Cost is list price only and never a quote: it cannot see negotiated          │
│ discounts, credits or private pricing agreements. Custom metric series are       │
│ billed per metric-month and this figure charges a full month for every new       │
│ series rather than prorating, so a short demo looks dearer than it bills.        │
╰──────────────────────────────────────────────────────────────────────────────────╯
PARANOID GUARD: telemetry will be rendered and costed but NOTHING will be sent to
AWS.
  guard: Cost is list price only and never a quote: it cannot see negotiated
discounts, credits or private pricing agreements. Custom metric series are billed
per metric-month and this figure charges a full month for every new series rather
than prorating, so a short demo looks dearer than it bills.
  guard: Paranoid policy: rendering and estimating only.
  guard: estimated cost of this run: ~$187.50 USD (approximate)
                      sent
 signal  ┃  accepted ┃ rejected ┃ requests ┃  MB
━━━━━━━━━╇━━━━━━━━━━━╇━━━━━━━━━━╇━━━━━━━━━━╇━━━━━
 logs    │ 1,877,531 │        0 │        0 │ 0.0
 metrics │ 9,383,077 │        0 │        0 │ 0.0
 rum     │   485,519 │        0 │        0 │ 0.0
 traces  │ 7,983,360 │        0 │        0 │ 0.0
elapsed 167.1s (dry run - nothing sent)
proteus faults
 kind                       ┃ signature
━━━━━━━━━━━━━━━━━━━━━━━━━━━━╇━━━━━━━━━━━━━━━━━━━━━━━━━━━━━━━━━━━━━━━━━━━━━━━━━━━━━━━
 queue-depth                │ Consumers fall behind: lag and queue depth climb,
                            │ latency rises moderately, errors flat.
 page-load-latency          │ Front-end page loads slow sharply with a flat error
                            │ rate.
 cpu-saturation             │ CPU pinned near 100%: latency degrades superlinearly,
                            │ with throttling in the logs.
 oom-kill                   │ Memory exceeds the limit, pods are OOM-killed and
                            │ restart; traffic dips in bursts.
 disk-full                  │ The volume fills and writes fail with ENOSPC.
 noisy-neighbor             │ A co-tenant saturates shared infrastructure; victims
                            │ slow with no local cause.
 connection-pool-exhaustion │ All pool connections are checked out: callers queue,
                            │ then time out waiting.
 cache-stampede             │ Cache hit ratio collapses and the miss storm
                            │ multiplies downstream load.
 agent-quality-regression   │ Agent answer quality drops while latency, errors, CPU
                            │ and tokens stay healthy.
 dependency-timeout         │ A downstream call hangs to its timeout ceiling, then
                            │ errors.
 network-packet-loss        │ Packets drop; retries stretch latency and leak a
                            │ moderate error rate.
 slow-query                 │ A query plan regresses: latency only, with flat CPU
                            │ and flat errors.
 shard-hotspot              │ Load skews onto one shard: it runs hot and rejects
                            │ work from a full queue.
 thread-pool-rejection      │ The work queue is full: errors dominate while latency
                            │ barely moves.
proteus show
╭─────────────────────────────────────────────────────────────────╮
│ northwind-rx rev 3  region us-west-2  env production  seed 1337 │
│ fingerprint 4648d1448e038cfe                                    │
╰─────────────────────────────────────────────────────────────────╯
                                      services
 name            ┃ archetype     ┃ runtime ┃ tenant  ┃ inst ┃ rps ┃ depends on
━━━━━━━━━━━━━━━━━╇━━━━━━━━━━━━━━━╇━━━━━━━━━╇━━━━━━━━━╇━━━━━━╇━━━━━╇━━━━━━━━━━━━━━━━━
 storefront-web  │ browser-rum   │ browser │ -       │ 1    │ 90  │ edge-alb
 edge-alb        │ alb           │ managed │ -       │ 1    │ 260 │ api-gateway
 api-gateway     │ nginx-web     │ ec2     │ -       │ 4    │ 250 │ checkout,
                 │               │         │         │      │     │ search,
the remaining service rows and most of the infra table are cut here to fit the page — the real command prints all 22 services and all 8 infra nodes
 ecs-batch     │ ecs-cluster       │ t-beta          │ mem_gib=64, vcpu=16
 ebs-data      │ ebs-volume        │ all tenants     │ iops=3000, storage_gib=200
                                     faults
 id       ┃ kind           ┃ target     ┃ severity ┃ window
━━━━━━━━━━╇━━━━━━━━━━━━━━━━╇━━━━━━━━━━━━╇━━━━━━━━━━╇━━━━━━━━━━━━━━━━━━━━━━━━━━━━━
 f-hykuqm │ noisy-neighbor │ rds-orders │ 0.60     │ 2026-09-24 14:20Z to 15:20Z
01 / PLAN
18 services that call each other, 8 pieces of shared infrastructure, 3 tenants — written to disk as data you can read, diff and edit. Nothing has touched AWS yet.
02 / DOCTOR
Read-only, and not decoration. Here it catches an estate that has drifted from the deployed stack, and prints the command that fixes it. It checks the rest of what silently ruins a demo too: retention shorter than your backfill, Transaction Search on the wrong destination, log groups that do not exist yet.
03 / SEED
A real dry run of the 18-service northwind-rx estate in us-west-2: fully rendered, fully costed, zero bytes sent. A dry run forces the paranoid guard, which makes no network call at all — so it prices from the built-in table rather than the live AWS Pricing API, and shows $187.50 across 469 new series. At live us-west-2 list price the same backfill projects about $153. Both are list price and never a quote: they cannot see your discounts, and the estimate charges a full metric-month for every new series instead of prorating, so a short run looks dearer than it bills. Every command that sends data goes through this guard, and no mode can skip it.
04 / FAULTS
Each kind has a signature an operator can recognise, which is what makes it findable. They ramp rather than step, and they contend through shared infrastructure — one sick database becomes latency in every service that touches it.
05 / SHOW
A grown estate — 22 services, one noisy-neighbor fault at severity 0.60 on the RDS instance t-alpha and t-beta share. The fault is deliberately asymmetric: the aggressor’s CPU climbs while the victim slows with no local cause. A symmetric one would not be findable, and finding it is the exercise.
Every record carries OpenTelemetry resource attributes -
service.name,
service.namespace,
deployment.environment,
cloud.provider,
cloud.region. Proteus sets all five on every record it
emits, plus the instance and runtime keys.
The spans carry something a metric cannot: the other end of the call.
peer.service and
parent_span_id name a pair, where a metric datapoint -
even one with an Entity attached - identifies a single
thing. That is the whole reason the tool speaks OTLP rather than pushing counters.
All of it is one incident, in one twenty-minute window: the
agent-quality-regression fault on
chat-agent in the
ai-chatbot estate. It is the fault an alarm cannot
find - four evaluator scores collapse together while latency, errors, CPU and token
usage all stay exactly where they were.
Five datapoints from one 60-second tick: four evaluator scores and one latency histogram. The resource attributes ride on every one. No metric name may begin AWS/ - CloudWatch reserves that namespace and discards the write without telling you.
{
  "resourceMetrics": [
    {
      "resource": {
        "attributes": [
          {"key": "agent_kind", "value": {"stringValue": "support-chat"}},
          {"key": "cloud.platform", "value": {"stringValue": "aws_bedrock"}},
          {"key": "cloud.provider", "value": {"stringValue": "aws"}},
          {"key": "cloud.region", "value": {"stringValue": "us-west-2"}},
          {"key": "deployment.environment", "value": {"stringValue": "production"}},
          {"key": "gen_ai.agent.name", "value": {"stringValue": "chat-agent"}},
          {"key": "gen_ai.request.model", "value": {"stringValue": "us.anthropic.claude-sonnet-5-v1:0"}},
          {"key": "gen_ai.system", "value": {"stringValue": "aws.bedrock"}},
          {"key": "proteus.tenant", "value": {"stringValue": "t-main"}},
          {"key": "service.name", "value": {"stringValue": "chat-agent"}},
          {"key": "service.namespace", "value": {"stringValue": "ai-chatbot"}}
        ]
      },
      "scopeMetrics": [
        {
          "scope": {
            "name": "proteus",
            "version": "0.1.0"
          },
          "metrics": [
            {
              "name": "proteus.agent.latency",
              "unit": "ms",
              "histogram": {
                "dataPoints": [
                  {
                    "startTimeUnixNano": "1789913520000000000",
                    "timeUnixNano": "1789913520000000000",
                    "count": "6",
                    "sum": 12341.742,
                    "bucketCounts": ["0", "0", "0", "0", "0", "0", "0", "0", "0", "0", "6", "0", "0", "0", "0"],
                    "explicitBounds": [1.0, 2.0, 5.0, 10.0, 25.0, 50.0, 100.0, 250.0, 500.0, 1000.0, 2500.0, 5000.0, 10000.0, 30000.0],
                    "attributes": [
                      {"key": "gen_ai.agent.name", "value": {"stringValue": "chat-agent"}},
                      {"key": "gen_ai.request.model", "value": {"stringValue": "us.anthropic.claude-sonnet-5-v1:0"}},
                      {"key": "proteus.aws_metric", "value": {"stringValue": "InvocationLatency"}},
                      {"key": "proteus.aws_namespace", "value": {"stringValue": "AWS/Bedrock"}}
                    ]
                  }
                ],
                "aggregationTemporality": "AGGREGATION_TEMPORALITY_DELTA"
              }
            },
            {
              "name": "proteus.agent.eval.score",
              "unit": "1",
              "gauge": {
                "dataPoints": [
                  {
                    "timeUnixNano": "1789913520000000000",
                    "asDouble": 0.6691166666666667,
                    "attributes": [
                      {"key": "gen_ai.agent.name", "value": {"stringValue": "chat-agent"}},
                      {"key": "gen_ai.request.model", "value": {"stringValue": "us.anthropic.claude-sonnet-5-v1:0"}},
                      {"key": "proteus.eval.evaluator", "value": {"stringValue": "correctness"}}
                    ]
                  },
                  {
                    "timeUnixNano": "1789913520000000000",
                    "asDouble": 0.6843333333333333,
                    "attributes": [
                      {"key": "gen_ai.agent.name", "value": {"stringValue": "chat-agent"}},
                      {"key": "gen_ai.request.model", "value": {"stringValue": "us.anthropic.claude-sonnet-5-v1:0"}},
                      {"key": "proteus.eval.evaluator", "value": {"stringValue": "coherence"}}
                    ]
                  },
                  {
                    "timeUnixNano": "1789913520000000000",
                    "asDouble": 0.6142500000000001,
                    "attributes": [
                      {"key": "gen_ai.agent.name", "value": {"stringValue": "chat-agent"}},
                      {"key": "gen_ai.request.model", "value": {"stringValue": "us.anthropic.claude-sonnet-5-v1:0"}},
                      {"key": "proteus.eval.evaluator", "value": {"stringValue": "retrieval_relevance"}}
                    ]
                  },
                  {
                    "timeUnixNano": "1789913520000000000",
                    "asDouble": 0.6549833333333334,
                    "attributes": [
                      {"key": "gen_ai.agent.name", "value": {"stringValue": "chat-agent"}},
                      {"key": "gen_ai.request.model", "value": {"stringValue": "us.anthropic.claude-sonnet-5-v1:0"}},
                      {"key": "proteus.eval.evaluator", "value": {"stringValue": "tool_selection"}}
                    ]
                  }
                ]
              }
            }
          ]
        }
      ]
    }
  ]
}
OTLP 1.x protobuf, gzipped past the compression threshold · 1,570 bytes on the wire, to https://monitoring.us-west-2.amazonaws.com/v1/metrics
What you are looking at is a rendering, not the bytes. The three OTLP endpoints take application/x-protobuf; this is protobuf’s canonical JSON mapping of the exact request body, readable where the bytes are not. Nothing sends this JSON.
Two things here look like bugs and are correct. 64-bit integers are quoted strings ("count": "6") because that is how proto3 maps them to JSON. Trace and span ids are hex rather than base64 because the OTLP/JSON spec overrides protobuf’s default for ids - which is also the only reason you can see that the log records and the trace carry the same traceId.
chat-agent · agent quality20 ticks at 60s, 14:00–14:20 UTC
proteus.agent.eval.score, four evaluators, all in one colour because the point is that they move together: coherence · correctness · retrieval_relevance · tool_selection.
And the metric an alarm would have been watching, over the same twenty minutes: proteus.agent.latency, mean ms. It is noisy either side of the boundary and there is no step at it.
That is the whole signature of this fault, as payloads.js records it: “agent eval scores only; latency, error rate, CPU and token usage stay at baseline”. Nothing a threshold alarm watches ever leaves baseline.
The fault a dashboard cannot show you. Nothing on the left steps. Latency stays noisy in the band it was already in - 1,526 to 3,982 ms either side. Error rate, CPU and token usage all sit at baseline. The only thing that moves is answer quality: retrieval relevance falls from about 0.86 to about 0.63, a drop of roughly 27%. A threshold alarm on latency or errors sees nothing here, because nothing it watches changed.
Four log records from the Bedrock agent, all carrying one trace id. The panel beside this lists six lines; two of them are the fault’s own and are not in this payload, because they go to a different log stream and the mandatory x-aws-log-group and x-aws-log-stream headers name exactly one.
{
  "resourceLogs": [
    {
      "resource": {
        "attributes": [
          {"key": "agent_kind", "value": {"stringValue": "support-chat"}},
          {"key": "cloud.platform", "value": {"stringValue": "aws_bedrock"}},
          {"key": "cloud.provider", "value": {"stringValue": "aws"}},
          {"key": "cloud.region", "value": {"stringValue": "us-west-2"}},
          {"key": "deployment.environment", "value": {"stringValue": "production"}},
          {"key": "gen_ai.agent.name", "value": {"stringValue": "chat-agent"}},
          {"key": "gen_ai.request.model", "value": {"stringValue": "us.anthropic.claude-sonnet-5-v1:0"}},
          {"key": "gen_ai.system", "value": {"stringValue": "aws.bedrock"}},
          {"key": "proteus.tenant", "value": {"stringValue": "t-main"}},
          {"key": "service.name", "value": {"stringValue": "chat-agent"}},
          {"key": "service.namespace", "value": {"stringValue": "ai-chatbot"}}
        ]
      },
      "scopeLogs": [
        {
          "scope": {
            "name": "proteus",
            "version": "0.1.0"
          },
          "logRecords": [
            {
              "timeUnixNano": "1789913520000000000",
              "severityNumber": "SEVERITY_NUMBER_INFO",
              "severityText": "INFO",
              "body": {
                "stringValue": "prompt session=sess-ozrv3qs0qw5o tokens=1021 text=\"Can demo-user-07 still return the blue widget from SYNTH-3390?\""
              },
              "attributes": [
                {"key": "proteus.log.scope", "value": {"stringValue": "request"}},
                {"key": "proteus.phase", "value": {"stringValue": "prompt"}},
                {"key": "proteus.synthetic", "value": {"boolValue": true}},
                {"key": "session.id", "value": {"stringValue": "sess-ozrv3qs0qw5o"}}
              ],
              "traceId": "19912cc3f5181a37b5c6555c96ecc7aa",
              "spanId": "a4d89deeedfc9ff7",
              "observedTimeUnixNano": "1789913520000000000"
            },
            {
              "timeUnixNano": "1789913521911058000",
              "severityNumber": "SEVERITY_NUMBER_INFO",
              "severityText": "INFO",
              "body": {
                "stringValue": "response session=sess-ozrv3qs0qw5o tokens=224 finish=end_turn text=\"Yes - SYNTH-3390 is inside the 30-day window; a label has been issued.\""
              },
              "attributes": [
                {"key": "proteus.eval.correctness", "value": {"doubleValue": 0.657}},
                {"key": "proteus.log.scope", "value": {"stringValue": "request"}},
                {"key": "proteus.phase", "value": {"stringValue": "response"}},
                {"key": "proteus.synthetic", "value": {"boolValue": true}},
                {"key": "session.id", "value": {"stringValue": "sess-ozrv3qs0qw5o"}}
              ],
              "traceId": "19912cc3f5181a37b5c6555c96ecc7aa",
              "spanId": "a4d89deeedfc9ff7",
              "observedTimeUnixNano": "1789913521911058000"
            },
            {
              "timeUnixNano": "1789913520000000000",
              "severityNumber": "SEVERITY_NUMBER_INFO",
              "severityText": "INFO",
              "body": {
                "stringValue": "tool=refund_policy_search calls=1 status=ok"
              },
              "attributes": [
                {"key": "gen_ai.tool.name", "value": {"stringValue": "refund_policy_search"}},
                {"key": "proteus.log.scope", "value": {"stringValue": "request"}},
                {"key": "proteus.synthetic", "value": {"boolValue": true}},
                {"key": "session.id", "value": {"stringValue": "sess-ozrv3qs0qw5o"}}
              ],
              "traceId": "19912cc3f5181a37b5c6555c96ecc7aa",
              "spanId": "a4d89deeedfc9ff7",
              "observedTimeUnixNano": "1789913520000000000"
            },
            {
              "timeUnixNano": "1789913520000000000",
              "severityNumber": "SEVERITY_NUMBER_INFO",
              "severityText": "INFO",
              "body": {
                "stringValue": "knowledge_base retrieval returned 4 chunks (top score 0.851)"
              },
              "attributes": [
                {"key": "proteus.log.scope", "value": {"stringValue": "request"}},
                {"key": "proteus.retrieval.hit_count", "value": {"intValue": "4"}},
                {"key": "proteus.synthetic", "value": {"boolValue": true}},
                {"key": "session.id", "value": {"stringValue": "sess-ozrv3qs0qw5o"}}
              ],
              "traceId": "19912cc3f5181a37b5c6555c96ecc7aa",
              "spanId": "a4d89deeedfc9ff7",
              "observedTimeUnixNano": "1789913520000000000"
            }
          ]
        }
      ]
    }
  ]
}
OTLP 1.x protobuf · 1,549 bytes on the wire, to https://logs.us-west-2.amazonaws.com/v1/logs
What you are looking at is a rendering, not the bytes. The three OTLP endpoints take application/x-protobuf; this is protobuf’s canonical JSON mapping of the exact request body, readable where the bytes are not. Nothing sends this JSON.
Two things here look like bugs and are correct. 64-bit integers are quoted strings ("count": "6") because that is how proto3 maps them to JSON. Trace and span ids are hex rather than base64 because the OTLP/JSON spec overrides protobuf’s default for ids - which is also the only reason you can see that the log records and the trace carry the same traceId.
/proteus/ai-chatbot/chat-agent2 streams, 14:12 UTC
In the request on the left · stream invocations/sess-ozrv3qs0qw5o
A separate request · stream invocations/fault
These last two are the fault’s own records, and they are not in the payload on the left because they physically cannot be: a batch carries mandatory x-aws-log-group and x-aws-log-stream headers that name exactly one stream, so one request cannot span two. The 4 above all carry the same trace id - 19912cc3…, the trace on the next tab. That correlation is real: the sample was selected by trace id.
One complete trace, all five spans: the agent invocation, the model call, two tool calls, and an outbound call to the vector store. Nothing trimmed. This endpoint rejects every request unless Transaction Search is enabled on the account.
{
  "resourceSpans": [
    {
      "resource": {
        "attributes": [
          {"key": "agent_kind", "value": {"stringValue": "support-chat"}},
          {"key": "cloud.platform", "value": {"stringValue": "aws_bedrock"}},
          {"key": "cloud.provider", "value": {"stringValue": "aws"}},
          {"key": "cloud.region", "value": {"stringValue": "us-west-2"}},
          {"key": "deployment.environment", "value": {"stringValue": "production"}},
          {"key": "gen_ai.agent.name", "value": {"stringValue": "chat-agent"}},
          {"key": "gen_ai.request.model", "value": {"stringValue": "us.anthropic.claude-sonnet-5-v1:0"}},
          {"key": "gen_ai.system", "value": {"stringValue": "aws.bedrock"}},
          {"key": "proteus.tenant", "value": {"stringValue": "t-main"}},
          {"key": "service.name", "value": {"stringValue": "chat-agent"}},
          {"key": "service.namespace", "value": {"stringValue": "ai-chatbot"}}
        ]
      },
      "scopeSpans": [
        {
          "scope": {
            "name": "proteus",
            "version": "0.1.0"
          },
          "spans": [
            {
              "traceId": "19912cc3f5181a37b5c6555c96ecc7aa",
              "spanId": "a4d89deeedfc9ff7",
              "name": "invoke_agent chat-agent",
              "kind": "SPAN_KIND_SERVER",
              "startTimeUnixNano": "1789913520000000000",
              "endTimeUnixNano": "1789913521911058000",
              "attributes": [
                {"key": "gen_ai.agent.name", "value": {"stringValue": "chat-agent"}},
                {"key": "gen_ai.operation.name", "value": {"stringValue": "invoke_agent"}},
                {"key": "gen_ai.request.model", "value": {"stringValue": "us.anthropic.claude-sonnet-5-v1:0"}},
                {"key": "gen_ai.response.finish_reason", "value": {"stringValue": "end_turn"}},
                {"key": "gen_ai.system", "value": {"stringValue": "aws.bedrock"}},
                {"key": "gen_ai.usage.input_tokens", "value": {"intValue": "1021"}},
                {"key": "gen_ai.usage.output_tokens", "value": {"intValue": "224"}},
                {"key": "proteus.eval.coherence", "value": {"doubleValue": 0.6757}},
                {"key": "proteus.eval.correctness", "value": {"doubleValue": 0.657}},
                {"key": "proteus.eval.retrieval_relevance", "value": {"doubleValue": 0.6038}},
                {"key": "proteus.eval.tool_selection", "value": {"doubleValue": 0.6446}},
                {"key": "proteus.guardrail.intervened", "value": {"boolValue": false}},
                {"key": "proteus.synthetic", "value": {"boolValue": true}},
                {"key": "session.id", "value": {"stringValue": "sess-ozrv3qs0qw5o"}}
              ],
              "status": {
                "code": "STATUS_CODE_OK"
              }
            },
            {
              "traceId": "19912cc3f5181a37b5c6555c96ecc7aa",
              "spanId": "f2081bebd0e43547",
              "parentSpanId": "a4d89deeedfc9ff7",
              "name": "chat us.anthropic.claude-sonnet-5-v1:0",
              "kind": "SPAN_KIND_INTERNAL",
              "startTimeUnixNano": "1789913520000000000",
              "endTimeUnixNano": "1789913521051082000",
              "attributes": [
                {"key": "gen_ai.operation.name", "value": {"stringValue": "chat"}},
                {"key": "gen_ai.request.model", "value": {"stringValue": "us.anthropic.claude-sonnet-5-v1:0"}},
                {"key": "gen_ai.request.temperature", "value": {"doubleValue": 0.279}},
                {"key": "gen_ai.response.finish_reason", "value": {"stringValue": "end_turn"}},
                {"key": "gen_ai.server.time_to_first_token", "value": {"doubleValue": 459.794}},
                {"key": "gen_ai.system", "value": {"stringValue": "aws.bedrock"}},
                {"key": "gen_ai.usage.input_tokens", "value": {"intValue": "1021"}},
                {"key": "gen_ai.usage.output_tokens", "value": {"intValue": "224"}},
                {"key": "session.id", "value": {"stringValue": "sess-ozrv3qs0qw5o"}}
              ],
              "status": {
                "code": "STATUS_CODE_OK"
              }
            },
            {
              "traceId": "19912cc3f5181a37b5c6555c96ecc7aa",
              "spanId": "dc47ae324dc46de7",
              "parentSpanId": "a4d89deeedfc9ff7",
              "name": "execute_tool refund_policy_search",
              "kind": "SPAN_KIND_INTERNAL",
              "startTimeUnixNano": "1789913521051082000",
              "endTimeUnixNano": "1789913521528846000",
              "attributes": [
                {"key": "gen_ai.operation.name", "value": {"stringValue": "execute_tool"}},
                {"key": "gen_ai.system", "value": {"stringValue": "aws.bedrock"}},
                {"key": "gen_ai.tool.name", "value": {"stringValue": "refund_policy_search"}},
                {"key": "proteus.tool.call_count", "value": {"intValue": "1"}},
                {"key": "session.id", "value": {"stringValue": "sess-ozrv3qs0qw5o"}}
              ],
              "status": {
                "code": "STATUS_CODE_OK"
              }
            },
            {
              "traceId": "19912cc3f5181a37b5c6555c96ecc7aa",
              "spanId": "f766c8a8c9be546b",
              "parentSpanId": "dc47ae324dc46de7",
              "name": "GET vector-search",
              "kind": "SPAN_KIND_CLIENT",
              "startTimeUnixNano": "1789913521051082000",
              "endTimeUnixNano": "1789913521481070000",
              "attributes": [
                {"key": "gen_ai.tool.name", "value": {"stringValue": "refund_policy_search"}},
                {"key": "http.request.method", "value": {"stringValue": "GET"}},
                {"key": "peer.service", "value": {"stringValue": "vector-search"}},
                {"key": "proteus.synthetic", "value": {"boolValue": true}},
                {"key": "server.address", "value": {"stringValue": "vector-search"}},
                {"key": "session.id", "value": {"stringValue": "sess-ozrv3qs0qw5o"}},
                {"key": "url.path", "value": {"stringValue": "/internal/vector-search"}}
              ],
              "status": {
                "code": "STATUS_CODE_OK"
              }
            },
            {
              "traceId": "19912cc3f5181a37b5c6555c96ecc7aa",
              "spanId": "8490e7c318a73c25",
              "parentSpanId": "a4d89deeedfc9ff7",
              "name": "execute_tool knowledge_base",
              "kind": "SPAN_KIND_INTERNAL",
              "startTimeUnixNano": "1789913521528846000",
              "endTimeUnixNano": "1789913521911058000",
              "attributes": [
                {"key": "gen_ai.operation.name", "value": {"stringValue": "execute_tool"}},
                {"key": "gen_ai.system", "value": {"stringValue": "aws.bedrock"}},
                {"key": "gen_ai.tool.name", "value": {"stringValue": "knowledge_base"}},
                {"key": "proteus.eval.retrieval_relevance", "value": {"doubleValue": 0.6038}},
                {"key": "proteus.retrieval.hit_count", "value": {"intValue": "4"}},
                {"key": "proteus.retrieval.top_score", "value": {"doubleValue": 0.851}},
                {"key": "proteus.step", "value": {"stringValue": "retrieval"}},
                {"key": "session.id", "value": {"stringValue": "sess-ozrv3qs0qw5o"}}
              ],
              "status": {
                "code": "STATUS_CODE_OK"
              }
            }
          ]
        }
      ]
    }
  ]
}
OTLP 1.x protobuf; the endpoint rejects every request unless Transaction Search is enabled on the account · 2,499 bytes on the wire, to https://xray.us-west-2.amazonaws.com/v1/traces
What you are looking at is a rendering, not the bytes. The three OTLP endpoints take application/x-protobuf; this is protobuf’s canonical JSON mapping of the exact request body, readable where the bytes are not. Nothing sends this JSON.
Two things here look like bugs and are correct. 64-bit integers are quoted strings ("count": "6") because that is how proto3 maps them to JSON. Trace and span ids are hex rather than base64 because the OTLP/JSON spec overrides protobuf’s default for ids - which is also the only reason you can see that the log records and the trace carry the same traceId.
trace 19912cc3…aa · invoke_agent chat-agent5 spans, 1,911 ms
One span has a peerService: GET vector-search out to vector-search. That is the cross-service edge - the thing Omni draws a line between two nodes from. It hangs off the tool-call span rather than off the root, so the tree is two levels deep.
The amber spans are where the fault is legible on the wire: invoke_agent chat-agent carries coherence, correctness, retrieval_relevance, tool_selection; execute_tool knowledge_base carries retrieval_relevance. The scores sit near 0.6 where the healthy baseline is above 0.85 - and every span in the trace still has status ok, with none of them slow. A trace view that only looked at duration and status would show nothing at all wrong here.
Four browser events from a single page view. A different endpoint with different limits and different failure modes - timestamps are whole Unix seconds here, so sub-second ordering within a batch does not survive.
{
  "BatchId": "51117f80-40f8-55d5-b36d-1a7f896957cf",
  "AppMonitorDetails": {
    "id": "<your-rum-app-monitor-id>",
    "name": "chat-web",
    "version": "1.0.0"
  },
  "UserDetails": {
    "sessionId": "e3da3196-e908-521e-a856-398e053ffa8e",
    "userId": "24708cea-aca5-5e5a-89b1-b08e54304ae5"
  },
  "RumEvents": [
    {
      "id": "754a0e63-7dbb-58fa-a886-8519e2fdff27",
      "timestamp": 1789913520,
      "type": "com.amazon.rum.page_view_event",
      "metadata": "{\"appMonitorName\": \"chat-web\", \"aws:client\": \"proteus\", \"aws:clientVersion\": \"1.0.0\", \"pageId\": \"/search\", \"sourceSessionId\": \"d4vzzaab47dt\", \"version\": \"1.0.0\"}",
      "details": "{\"app_monitor\": \"chat-web\", \"pageTags\": \"storefront\", \"platform\": \"Android\", \"proteus.synthetic\": true}"
    },
    {
      "id": "e2ee7864-af44-555f-9a87-b015c03d9d49",
      "timestamp": 1789913520,
      "type": "com.amazon.rum.performance_navigation_event",
      "metadata": "{\"appMonitorName\": \"chat-web\", \"aws:client\": \"proteus\", \"aws:clientVersion\": \"1.0.0\", \"pageId\": \"/search\", \"sourceSessionId\": \"d4vzzaab47dt\", \"version\": \"1.0.0\"}",
      "details": "{\"app_monitor\": \"chat-web\", \"cumulativeLayoutShift\": 0.0793, \"domComplete\": 821.327, \"duration\": 1025.86, \"firstInputDelay\": 18.506, \"largestContentfulPaint\": 645.883, \"navigationType\": \"navigate\", \"platform\": \"Android\", \"proteus.synthetic\": true, \"timeToFirstByte\": 187.618}"
    },
    {
      "id": "6e55bc67-2c65-50c8-9d35-534b996bbcfe",
      "timestamp": 1789913520,
      "type": "com.amazon.rum.performance_resource_event",
      "metadata": "{\"appMonitorName\": \"chat-web\", \"aws:client\": \"proteus\", \"aws:clientVersion\": \"1.0.0\", \"pageId\": \"/search\", \"sourceSessionId\": \"d4vzzaab47dt\", \"version\": \"1.0.0\"}",
      "details": "{\"app_monitor\": \"chat-web\", \"duration\": 253.882, \"initiatorType\": \"css\", \"platform\": \"Android\", \"proteus.synthetic\": true, \"targetUrl\": \"/static/theme.css\", \"transferSize\": 18432}"
    },
    {
      "id": "ac3c143d-db44-5665-b7fb-be2429e5139b",
      "timestamp": 1789913520,
      "type": "com.amazon.rum.http_event",
      "metadata": "{\"appMonitorName\": \"chat-web\", \"aws:client\": \"proteus\", \"aws:clientVersion\": \"1.0.0\", \"pageId\": \"/search\", \"sourceSessionId\": \"d4vzzaab47dt\", \"version\": \"1.0.0\"}",
      "details": "{\"app_monitor\": \"chat-web\", \"duration\": 253.882, \"http.method\": \"GET\", \"http.status_code\": 200, \"http.url\": \"/api/v1/inventory\", \"platform\": \"Android\", \"proteus.synthetic\": true}"
    }
  ]
}
PutRumEvents JSON - not OTLP; browser telemetry goes to the RUM data plane · 2,457 bytes on the wire, to https://dataplane.rum.us-west-2.amazonaws.com/appmonitors/<your-rum-app-monitor-id>/
chat-web · page /search4 events, session d4vzzaab47dt
Nothing is highlighted in the payload, and that is the point: a RUM event carries no OpenTelemetry resource - the app monitor name is its identity - which is the same reason it does not travel the OTLP path. The browser reaches Omni’s service map through the OTLP metrics chat-web emits alongside these events.
The panel on the right is an illustration, not a screenshot. Nobody on this project has access to CloudWatch Omni. It is drawn from the structure of the payload on the left and from public AWS documentation, to show which field ends up where - not to show you a console anyone has seen.
The region in these endpoints is whatever --region you
pass; the samples were captured for us-west-2.
Captured from the real renderer by
scripts/capture-payload-samples.py: the
ai-chatbot preset in
us-west-2 at seed 1337, over
20 minutes at 60-second sampling, with
agent-quality-regression aimed at
chat-agent from ten minutes in. The same seed
and the same model give the same bytes, so every figure here reproduces -
tests/test_payload_samples.py fails if it stops doing so.
A hand-written layer for the things that need real internal behaviour, and a declarative layer for everything AWS exposes as metrics.
Web tier, Postgres, Kafka producer and consumer, OpenSearch, EKS and ECS workloads, Lambda, an AI agent, a RUM browser app. Each one has internal state, so a Kafka consumer's lag responds to its producer's rate rather than being drawn independently.
SQS, DynamoDB, CloudFront, SageMaker, ALB, NLB and CLB, ElastiCache, RDS, Redshift, EMR, Step Functions, API Gateway, and on - 393 metric specifications across 56 AWS namespaces. Adding a service is an edit to a data file, not new code.
Each metric names the AWS metric it models. Where that mapping is unconfirmed it is left null and shown as unknown, because an invented metric name reads as authoritative and sends an operator hunting an alarm that cannot exist.
The northwind-rx preset places 18 services over 8
infrastructure nodes shared by 3 tenants.
proteus plan --preset <name> builds a world model
without touching AWS. The default, northwind-rx, is 18
connected services across every archetype - enough to hide an incident in, and more
telemetry than you want to pay for on a first run.
The other five are the opposite trade: a shape you recognise on sight, small enough
that the first seed is cheap. Every one of them is a
single connected dependency graph, because Omni draws topology from the telemetry
and a set of unrelated workloads renders as islands.
proteus plan --preset three-tier
alb-fleet is three services, not twelve: the fleet is one
service with ten instances, because that is what a target group is. Ten peers
reporting under one name is what makes a single sick host legible.
ml-pipeline is the one preset that asks for
--interval 300. A one-minute grid over a stage that runs
twenty minutes is twenty times the datapoints for no extra resolution of anything real
- and five minutes is the grid the real services report on. Every command still takes
--interval and the flag always wins.
Easy to draw and useless to practise on - that is the trouble with a spike. These degrade the way real faults do: gradually, in more than one place, and not always where the cause is.
A fault scales in over its window rather than switching on. A square edge tells an operator where to look before they have looked, which defeats the exercise.
Aim a fault at an infrastructure node and every service using that node degrades with it. One sick database shows up as latency in the services that touch it - and the page they will open first is the one with no local cause.
noisy-neighbor hurts the wrong tenant.The aggressor and the victim get genuinely different signatures. As the source puts it: the aggressor looks busy; the victims look broken, with no local cause. A symmetric version would not be findable, and finding it is the exercise.
Or let the tool hide one. proteus hunt start injects a
fault without telling you which; proteus hunt guess scores
your diagnosis on cause, target and window.
A fault goes into the estate and you are told nothing about it. You work it in CloudWatch the way you would work a real incident - read the service map, follow the latency, find what changed - then write down what you think happened and get scored on it.
This is the part that turns a data generator into an exercise. The estate is synthetic; the reasoning you have to do is not.
proteus hunt start --difficulty mediumChoose easy, medium or hard. Medium is the default.
Open Omni and work the incident. This is the whole point of the exercise, and nothing in the tool can do it for you.
proteus hunt guess <hunt-id> "the orders database is saturating and checkout is queueing behind it"Write what you think went wrong in your own words. Bedrock grades it on three axes and tells you how you did on each.
proteus hunt revealNames the fault and which signals carried the evidence, so a hunt you lost still teaches you where to look next time. proteus hunt list shows your hunts and never their answers.
A diagnosis is rarely wholly right or wholly wrong, so it is not graded that way. Each axis is an integer from 0 to 100.
affected rather than zero, and landing within about 15 minutes of the window is full marks on window.The grader is asked for a hint that gives nothing away. Its answer is then checked rather than trusted: every string bound for you is re-read against the sealed fault, and if the model named the cause, the target or the clock, the hint is thrown away and replaced with one derived from your scores alone.
It discards the whole sentence rather than editing it, because a partially redacted sentence still shows its shape. And a score-derived hint cannot leak by construction - it only knows which axis you missed.
proteus show redacts a hidden fault for the same reason, including its id, because the id embeds the kind. The first live hunt printed its own answer through that table. proteus hunt reveal is the only sanctioned way to see the fault.
Grading runs on Amazon Bedrock, so hunt start and hunt guess need Bedrock access in the region you point them at. Both take --region and --profile. Everything else in Proteus runs without it.
Type what you want and the model edits the estate to match: add a checkout service behind the API gateway, give it a Postgres it shares with orders, then make that database run out of connections for twenty minutes. You get a world model, and the renderer turns it into telemetry afterwards.
The tool's own help text is the whole story: the AI edits the model, never the data. It has no way to write a datapoint, invent a metric name or reach the network. That is why the output stays deterministic - the same model and the same seed produce the same telemetry whether you composed the estate by hand, on the canvas, or by asking for it.
proteus chat "make the orders database run out of connections for twenty minutes"Pass a message for a single edit, or run proteus chat with no message for a REPL.
The model is not handed your config and asked to rewrite it. It gets a fixed set of structured operations, and those are the only changes it can express.
Every proposed edit is validated before it lands. A name has to match the schema's pattern, a number has to fall inside its range, a service cannot depend on itself, and a fault window has to sit inside the same ingest bounds the emitters enforce - no more than 14 days back and 2 hours ahead.
An invalid edit is refused whole rather than partly applied. The validators return a clean value or raise, and none of them mutate anything, so a rejection can never leave you with a half-edited model to untangle.
This is the same principle hunt mode uses to keep its answer sealed: a prompt is a request, and the code is the guarantee. The model proposes; the schema decides.
It also cannot interfere with an open hunt. Chat may never create a hidden fault - that is hunt's job - and it refuses to remove a hidden fault or a service a hunt is pointed at, telling you to run proteus hunt reveal first. You cannot solve a hunt by asking the AI what is wrong with your estate.
Like hunt mode, this runs on Amazon Bedrock, so proteus chat needs Bedrock access in the region you point it at. It takes --region and --profile. Everything outside these two sections works without it.
Drag workloads out of the palette, wire their dependencies, drop faults onto services and infrastructure, and watch the cost projection change as you go. Nothing reaches AWS until you press inject.
Vanilla ES modules and a stdlib HTTP server. No build step, no npm, no framework.
Origin header - the process holds your AWS credentials and can spend money.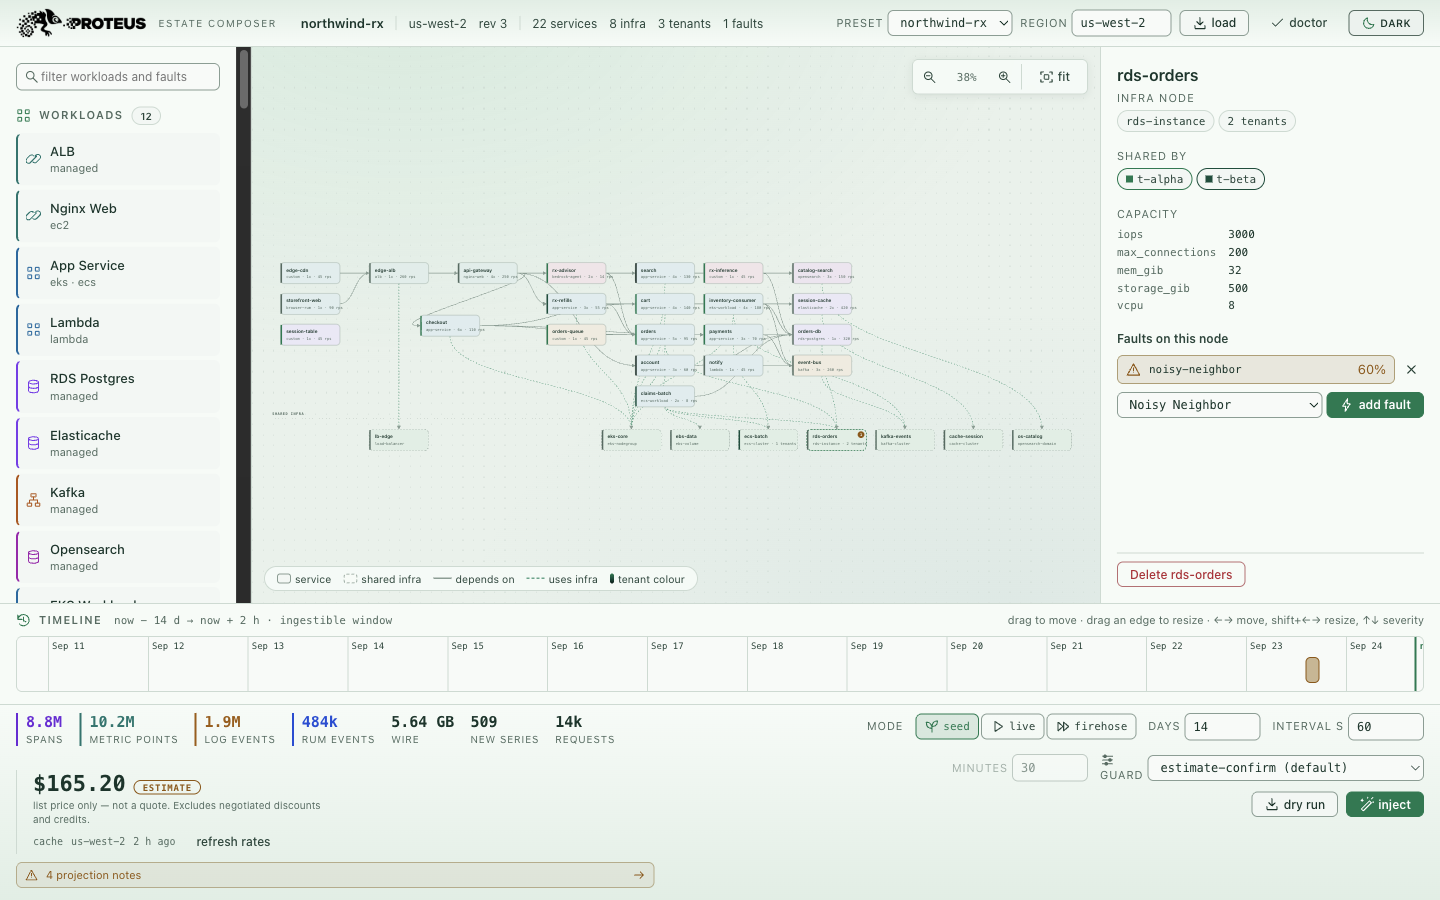
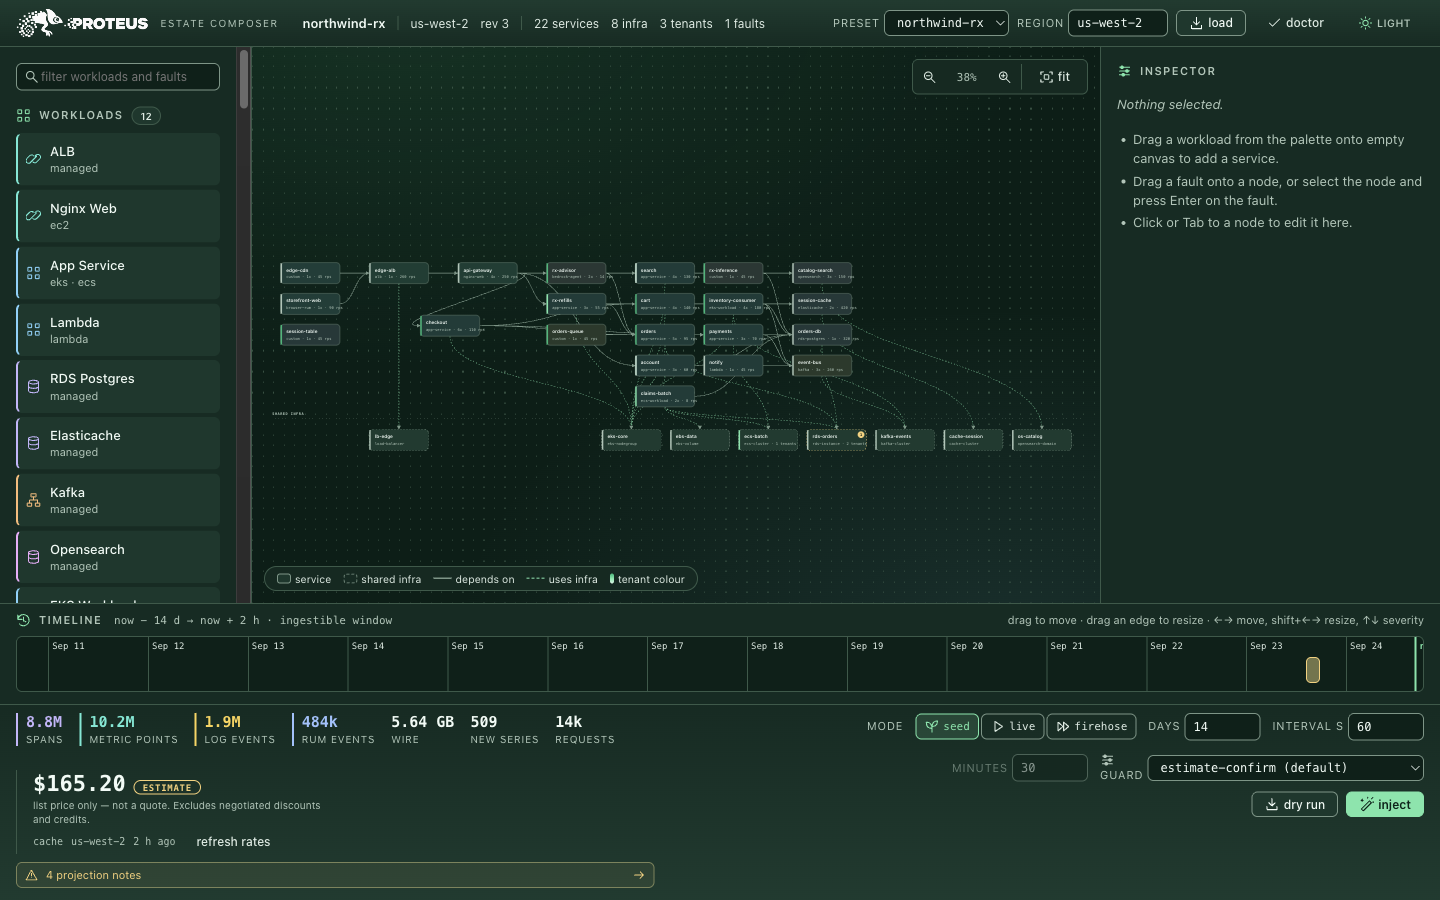
proteus serve. Serves the GUI on 127.0.0.1:8787.
Seeding makes real API calls and CloudWatch bills you for them. So every command that sends data routes through the same guard, and no mode can skip it: the guard projects the volume and the cost, shows you the figure, and by default waits for an explicit yes.
A 14-day backfill of the 18-service default estate projects about $153 at list
price in us-west-2.
--dry-run prices the same estate without sending
anything - and reads higher, because it makes no network call at all and so falls
back to the built-in rate table instead of the live Pricing API.
--cap defaults to 50 USD.A cost figure someone acts on has to be wrong in the safe direction, if it is wrong at all. That is why the projection over-states rather than under-states, and why it says which way it leans.
Python 3.12 or newer, and AWS credentials for an account you are willing to spend a little money in.
There is no published release yet, so the honest instruction is to clone and install. The releases page is linked above and may be empty today.
git clone https://github.com/crazy54/PROTEUS.git proteus && cd proteuspython3.12 -m venv .venv && .venv/bin/pip install -e .
That puts a proteus command in
.venv/bin. Eight runtime dependencies, two more for
the tests, and zero npm.
proteus plan
proteus bootstrap
proteus doctor
proteus seed
Run doctor. It is a read-only preflight, it catches
the failures that otherwise waste a demo slot, and every check it fails prints
the command that fixes it.
The docs build refuses to publish a page with missing front matter, a dead internal link or a missing image, because all three fail silently otherwise.
Clone it, run four commands, and open Omni against an estate that behaves like production.